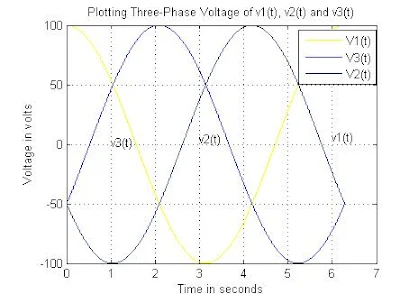
Plotting Voltage

M-File Programming For Subplotting:

clc

clear

subplot(2,2,1)

x=0:pi/1800:2*pi;

y=sin(x);

plot(x,y);

title('Plot of sin(x)');

grid

subplot(2,2,2)

x=0:pi/1800:2*pi;

y=sin(x-2*pi/3)

plot(x,y);

title('Plot of sin(x-120)');

grid

subplot(2,2,3)

x=0:pi/1800:2*pi;

y=sin(x+2*pi/3)

plot(x,y);

title('Plot of sin(x-240)');

grid

(try it)


M-File Programming For Three-Phase Voltage:

clc

clear

t=0:pi/1800:2*pi;

v1=100*cos(t);

plot(t,v1);

grid

hold on

v2=100*cos(t-2*pi/3);

plot(t,v2);

v3=100*cos(t+2*pi/3);

plot (t,v3);

title('Plotting Three-Phase Voltage of v1(t), v2(t) and v3(t)')

xlabel ('Time in seconds')

ylabel ('Voltage in volts')

text (6,6,'v1(t)')

text (3,4,'v2(t)')

text (1,1,'v3(t)')

(try it)

Discussion:

· Plotting figure is also called graphing figure in MATLAB.

· In this programming, we can easily draw a different kind of equation’s figure by MATLAB programming.

· In the first programming, we can combine multiple plots on the same page by using calls to the subplot(m,n,p) command.

· This command breaks the figure window into a m-by-n matrix of small subplots and selects the p-th subplot for the current plot.

· The subplots are numbered starting at 1 and increasing along rows to the value max at bottom right of the matrix.

· In the second programming, the program is a sequence of MATLAB commands that will allow us to do this.

· ; at the end of a line defines the command but does not immediately execute it.

· * is used to multiply two functions.

· The command ‘hold on’ keeps the existing graph and adds the next one to it.

· The command ‘plot’ can plot more than one function simultaneously.

· In the plot command we can specify the color line.

· So to say finally, MATLAB allow creating plots of functions easily.


Comments

Popular Posts

Matrix calculation with MATLAB Programming

First, let's create a simple vector with 9 elements called a . a = [1 2 3 4 6 4 3 4 5] a = 1 2 3 4 6 4 3 4 5 Now let's add 2 to each element of our vector, a , and store the result in a new vector. Notice how MATLAB requires no special handling of vector or matrix math. b = a + 2 b = 3 4 5 6 8 6 5 6 7 Creating graphs in MATLAB is as easy as one command. Let's plot the result of our vector addition with grid lines. plot(b) grid on MATLAB can make other graph types as well, with axis labels. bar(b) xlabel( 'Sample #' ) ylabel( 'Pounds' ) MATLAB can use symbols in plots as well. Here is an example using stars to mark the points. MATLAB offers a variety of other symbols and line types. plot(b, '*' ) axis([0 10 0 10]) One area in which MATLAB excels is matrix computation. Creating a matrix is as easy as making a vector, using semicolons (;) to separate the rows of a matrix. A = [1 2

Studying The Charecteristics of a Transmission Line by MATLAB Programming

M-File Programming for Transmission Line: clc clear disp( 'STUDYING THE CHARECTERISTICS OF A TRANSMISSION LINE' ) disp( '***************************************************' ) disp( ' ' ) V=input( 'Receiving end line voltage in volt =' ); L=input( 'length of transmission line in km =' ); Pr=input( 'Rated power at receiving end load =' ); pf=input( 'power factor=' ); I=Pr/(sqrt(3)*V*pf); a1=acos(pf); Vr=V/sqrt(3) Ir=I*cos(a1)-j*I*sin(a1) r=input( 'resistance/km/phase=' ); x=input( 'inductive reactance/km/phase=' ); R=r*L; X=j*x*L; Z=R+X if V>20000 y=input( 'capacitive susceptance/km/phase=' ); Y=j*y*L m=Y*Z; end if V<20000 disp( 'SHORT TRANSMISSON LINE' ) disp( '**********************' ) A=1 B=Z C=0 D=A end if V>20000 & V<1

Per-Unit Quantities

M-File Programming For Finding Per-Unit Impedance: -clc -clear -disp('CHANGING THE BASE OF PER-UNIT QUANTITIES') -x=input('given base MVA='); -y=input('given base KV='); -z=input('given per unit impedence='); -a=input('new base MVA='); -b=input('new base KV='); -disp('new per unit impedence='); -pu=z*(y/b)^2*(a/x) (Try it) M-File Programming For Finding Per-Unit Impedance: -clc -clear -disp('PERCENTAGE TRANSMISSION EFFICIENCY OF TX-LINE') -x=input('Receiving end voltage='); -y=input('Load current per-phase='); -z=input('Receiving end power factor='); -a=input('Sending end current='); -b=input('Resistance per-phase='); -disp('Percentage voltage transmission efficiency='); -PVTE=(((x*y*z)/((x*y*z)+(a^2*b)))*100 (try it)